Environmental
Climate change
- GRI 3‑3 Management of material topics
- GRI 201‑2 Financial implications and other risks and opportunities due to climate change
Climate Change – governance
Our climate governance framework is designed to ensure that we not only comply with environmental regulations but also proactively mitigate climate‑related risks and capitalise on opportunities. The governing framework integrates climate considerations into our corporate strategy and operational practices.
The Board monitors and oversees the achievement of climate‑related targets and receives updated metrics at least annually. Senior management reports climate‑related issues to the Board at least annually. At present, there are no financial incentives for the management regarding climate change issues. The Company does not use an internal carbon price.
Energy transition strategy
ACWA Power’s growth strategy sets the ambition on how much capacity we plan to have by 2030, broken down into renewable power, flexible generation (allowing for periodic full load, including fast startup, shutdown, but also operation at part load), green hydrogen and water desalination.
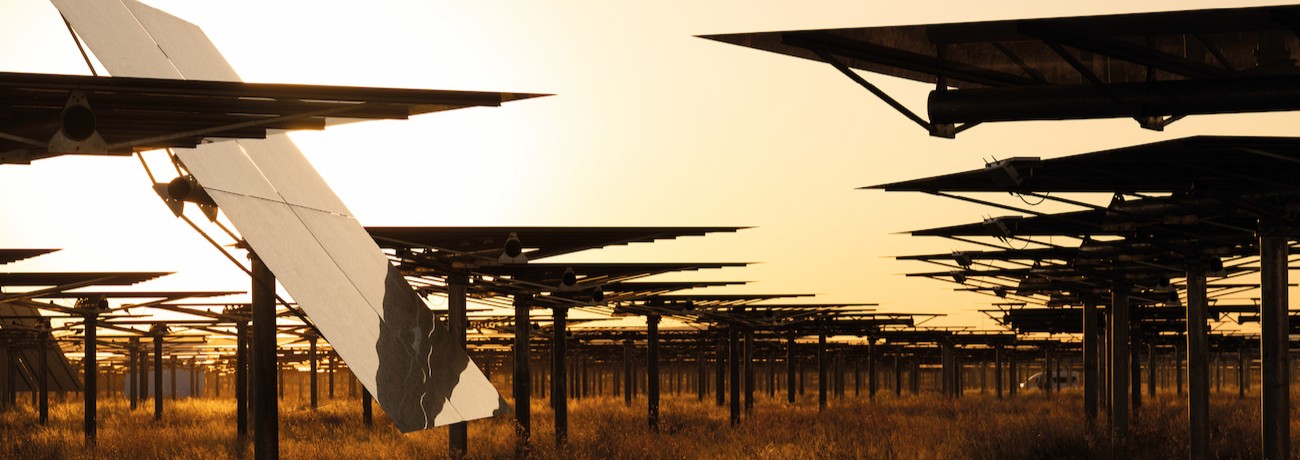
Four technologies we operate
Key contributions to energy transition
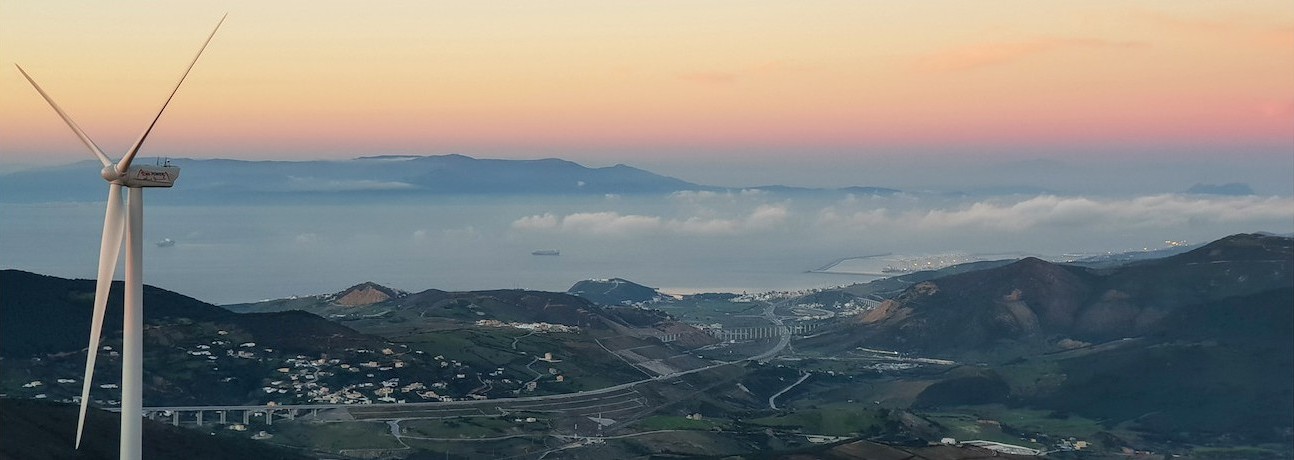
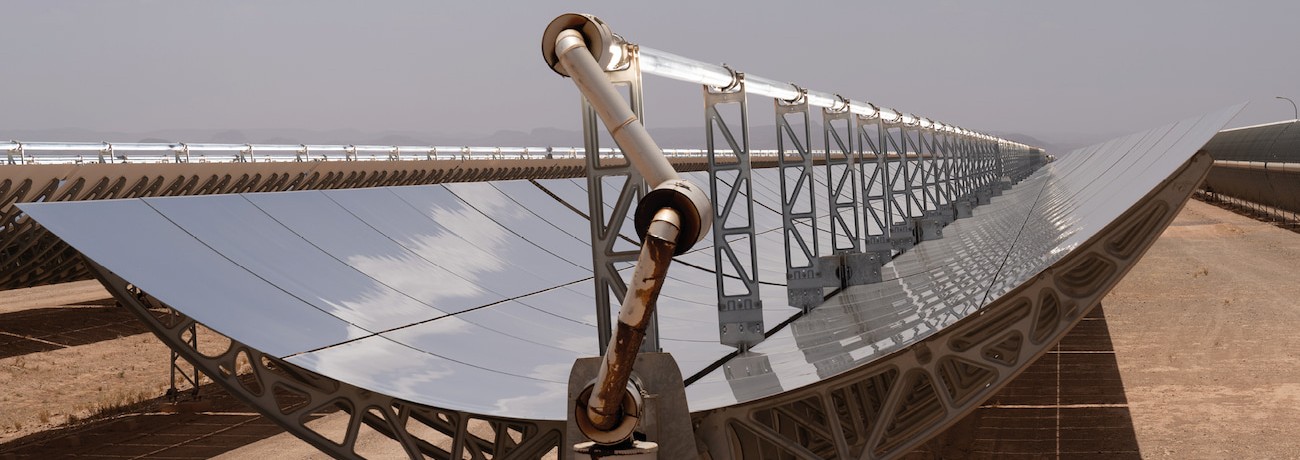
ACWA Power has significantly expanded its portfolio of renewable energy projects, deploying vast capacities of solar photovoltaic (PV), concentrated solar power (CSP), and wind energy across multiple regions. These projects directly contribute to reducing carbon emissions by displacing fossil fuel‑based electricity generation.
Flexible generation facilities play a pivotal role in stabilising the energy grid that can rapidly adjust output as per the demand. The adaptability of the facilities is essential for integrating a higher proportion of variable renewable energy sources, thereby supporting a seamless transition to a renewable‑heavy grid and maintaining continuous power supply.
Green hydrogen produced through the electrolysis of water using renewable sources like solar and wind, offers a zero‑emission alternative to traditional fuels. It plays a crucial role in energy storage and grid stability, and is key to decarbonising hard‑to‑abate sectors such as heavy transport and manufacturing. Its flexibility allows it to be used broadly, from generating electricity and heat to serving industrial and domestic needs, marking it as a key player in the global energy transition.
Water desalination is increasingly crucial as an adaptation strategy in regions suffering from high water stress. These facilities are vital in bridging the gap in water demand during worsening climate conditions where freshwater availability is diminishing. Integrating renewable energy systems into water desalination processes significantly reduces the carbon footprint of water production.
Short term strategy (to 2025): Having initially targeted a green‑brown energy ratio of 50% by 2030, we surpassed that goal in 2024, six years ahead of schedule, reaching a renewable capacity of 50.4%. Building on this momentum, our near‑term focus is on expanding large‑scale renewable projects, with particular emphasis on green hydrogen as a transformative solution for low‑carbon energy systems. We will continue to invest in research and development to enhance energy efficiency across our portfolio, seeking both technological advancements and operational improvements that boost overall project performance. These efforts align with our broader commitment to support a sustainable energy transition without compromising financial resilience. Given our track record and strategic positioning, we do not anticipate any significant financial impacts stemming from climate‑related issues in the immediate term.
Mid‑term strategy (to 2030): As we aim to have USD 250 billion of assets under management by 2030, more than 75% of power additions will be from renewables, in which we plan to add 5x more RES compared to flexible generation. These additions will ensure that we meet our 2030 target to reduce our emissions intensity (tCO2e/MWh) by 50% relative to our 2020 level. Furthermore, following our early achievement of the previously set target, we have revised our green‑brown ratio goal, aiming for a more ambitious target of 70% by 2030. Additionally, we have plans to increase the amount of renewable power being used as the source of energy in our water desalination business, to further support the decarbonisation of our water portfolio. At this stage, we do not anticipate any significant financial impacts arising from climate‑related issues.
Long‑term strategy (more than 10 years, up to 2050): Looking beyond 2030, ACWA Power will significantly expand its renewable energy capacity, ensuring that renewables remain central to our growth trajectory through 2040 and 2050. We will build on our progress by exploring emerging renewable technologies, scaling green hydrogen initiatives, and innovating across our portfolio to maximise low‑carbon energy generation. We will continue to engage with offtakers to explore decarbonisation options for our fossil fuel facilities. Although flexible generation may still be required by 2050, we anticipate that these plants will operate primarily as peak‑load facilities with very low‑capacity utilisation. To achieve our net zero target, we will reduce and eventually eliminate operational emissions. As a leader in power technology, we will monitor and develop solutions to decarbonise our flexible generation fleet. Initiatives will include fuel switching, potentially substituting or mixing natural gas with green hydrogen, as well as implementing Carbon Capture and Storage (CCS) and Carbon Capture Utilisation and Storage (CCUS) technologies to further remove CO2 emissions, ensuring we meet our net zero goal by 2050. We will also consider offsetting our residual emissions with credits from removal‑based solutions, including both nature‑based and technology‑based approaches. In line with this strategy, we have established long‑term emissions projections and defined measures to offset remaining emissions. Over the longer horizon, we recognise that policy and technological risks could have potential financial implications, and we continue to proactively manage these uncertainties to safeguard our vision of becoming a fully decarbonised energy leader by mid‑century.
Climate Risk Management
As global attention intensifies on the impacts of climate change, ACWA Power is at the forefront of integrating comprehensive climate risk assessments into our operational and strategic frameworks. The scope of our climate risk assessment extends across all geographies where we operate, ensuring a thorough understanding of both global and localised environmental impacts on our business.
Our risk assessment distinguishes between physical and transition risks:
Physical risk
It includes both acute and chronic alterations in climate patterns, such as extreme weather events and persistent changes in temperature and precipitation, which could potentially disrupt our operations and damage infrastructure.
Transition risk
It arises from the global shift towards a low‑carbon economy, encompassing regulatory, technological, market changes and reputational impact. These risks reflect potential costs and operational challenges associated with adapting to new laws, changing technologies, and evolving market expectations.
To navigate and manage the complex landscape of climate‑related risks, ACWA Power employs a suite of sophisticated tools that enable robust scenario planning and risk assessment. By leveraging these advanced tools, ACWA Power can more accurately analyse for both the physical impacts of climate change and the transition risks associated with a shifting global energy paradigm.
Aqueduct Water Risk Atlas
We employ the Aqueduct Water Risk Atlas, developed by the World Resources Institute (WRI), as a key tool in assessing water‑related risks across our global operations.
NGFS Climate Impact Explorer
This tool is used to assess physical risks by providing granular, region‑specific data on climate hazards such as heatwaves, floods, droughts, and sea‑level rise. It leverages climate models and scenarios to project the frequency, intensity, and geographical distribution of these events under different future climate conditions.
REMIND‑MAgPIE Model
This model is pivotal in our toolkit due to its integrated assessment framework that simulates the interplay between economic development and technological evolution in the energy sector under various climate policy scenarios. The model’s ability to forecast the implications of energy helps us to anticipate future shifts in variables under different regulatory and technological scenarios.
WEO 2024 Data
The World Energy Outlook (WEO) 2024 data provide critical insights into global energy trends and projections. By integrating this data, we gain an additional validation of potential future energy market developments and policy directions.
Scenarios and timeline
ACWA Power recognises that many plausible futures exist, with differences in global temperature pathway, changes in climate regulations, and changing market preferences. It is also plausible that climate action in MENA region occurs at a different pace from elsewhere in the world, potentially creating unique transition impacts for us. Hence, ACWA Power has chosen three scenarios that are closest to the reality of future development, which aim to provide sufficiently distinct and plausible future to help us test the resilience of our business model and strategy, identify and assess climate related risks and opportunities.
In conducting our climate risk assessment, ACWA Power has designated key reference years that align with our strategic planning timeline: 2025 for short‑term goals, 2030 for mid‑term objectives, and 2050 for long‑term aspirations. These milestones are chosen to reflect the evolving scope of our projects and investments, ensuring that our strategies are both responsive and forward‑looking.
Identification and evaluation of physical risk and opportunities
Climate change‑related physical risks vary by location and technology, evolving gradually over long periods. This analysis examines three scenarios: Delayed Transition, Current Policy, and Fragmented World. However, the severity and scale of physical risks are directly proportional to the warming effect. The findings presented below identify the main climate risks for the company’s various assets, highlighting the worst‑case scenario among the three examined. The identification of key impacts, risks, and associated opportunities is based on the sensitivity of each technology, the projected changes in climate threats at a regional level, and the exposure of assets.
| Technology/activity | ||||||||
|---|---|---|---|---|---|---|---|---|
| Renewables | Desalination | Thermal power | ||||||
| Climate change elements | PV | CSP tower | CSP parabolic | Wind | Thermal | Membrane | Steam generator | CCGT |
| Heat & cold | ||||||||
| Wet & dry | ||||||||
| Wind | ||||||||
| Snow & ice | ||||||||
| Coastal | ||||||||
| Oceanic | ||||||||
| Additional risksAir pollution weather, atmospheric CO2e at surface, level of lakes, radiation at surface, relative humidity. | ||||||||
| Technology/activity | ||||||||
|---|---|---|---|---|---|---|---|---|
| Renewables | Desalination | Thermal power | ||||||
| Climate change elements | PV | CSP tower | CSP parabolic | Wind | Thermal | Membrane | Steam generator | CCGT |
| Heat & cold | ||||||||
| Wet & dry | ||||||||
| Wind | ||||||||
| Snow & ice | ||||||||
| Coastal | ||||||||
| Oceanic | ||||||||
| Additional risksAir pollution weather, radiation at surface, air pressure. | ||||||||
| Risk | Main threats | Impact | Residual Risk Rating | Management | Opportunities | ||
|---|---|---|---|---|---|---|---|
| 2025 | 2030 | 2050 | |||||
| Acute | Heatwave | Module efficiency lower with increased temperature. Potentially decreases CCGT’s output due to lower air density and gas turbine mass flow. Decrease employee’s productivity. Increased water demand for cooling processes, straining water resources. Risk of equipment overheating, leading to higher maintenance and failure rates. | System optimisation for temperature variations with appropriate materials and components. Minimise outdoor exposure of employee during extreme heat condition. | Increase digitisation and deployment of artificial intelligence technology to reduce the respond time. Increase more resilient design and robust structure where applicable. Improvement of reliability and security of supply during extreme events. Implement predictive maintenance systems using IoT to avoid heat‑related failures. Build nature‑based solutions, like mangroves or wetlands, to naturally mitigate flooding. | |||
| Severe windstorm/ Tropical cyclone/Dust storm | Physical damage to the facilities leading to operation disruption. Decrease production and performance due to soiling and potential erosion. Increase in insurance premium in the location prone to storms. Supply chain disruption. | Ensure robust structural design that can withstand high wind speed. Utilise erosion resistant material for equipment with high exposure. Optimise operation of wind turbine for various wind speeds. Conduct regular maintenance and develop emergency response plans to mitigate impact. | |||||
| Riverine Floods | Increase the risk of flooding, leading to physical damage to infrastructure, buildings, and equipment. Operation disruption Permanent asset devaluation in high‑risk flood zones.
| Install water resistant materials for flood‑proofing Improve drainage system to increase runoff and floodwaters more effectively Land‑use planning and zoning to reduce the exposure. | |||||
| Coastal Floods | |||||||
| Hail | Physical damage to the facilities leading to operation disruption and generation reduction. | Use impact resistance material for key equipment. Reinforce structures to withstand the impact. | |||||
| Chronic | Average temperature rise | Decrease production and performance. Increase membrane’s specific power consumption that leads to higher operating cost. Decrease in access to freshwater source. | Convert to more efficient technology. Increase efficiency of water desalination technology via implementing optimisation tools. Use onsite water desalination plants to provide freshwater for the daily usage. Conduct a water recycling programme. Integrate water desalination with onsite captive PV plant. | Increase digitisation and deployment of artificial intelligence technology to optimise chemical dosing and power consumption, predict failures and enhance preventive maintenance. Increase research and development capability to further improve the operation efficiency and resilience. Accelerate the decarbonisation effort in the sector | |||
| Drought | Decrease freshwater accessibility for operations. Operation disruption. | ||||||
| Oceanic effect (mean ocean temperature, ocean acidity and salinity) | Increase in specific power consumption due to higher temperature and salinity. Reduction in production due to degradation of membranes. Changes of ocean acidity affect pretreatment chemical dosing process. | ||||||
| Sea level rise | Increase the risk of coastal flooding and storm surges, leading to physical damage to infrastructure, buildings, and equipment. Operation disruption. Asset depreciation. Stranded asset. Increase of insurance cost. | Install water‑resistant materials for flood‑proofing. Improve drainage system to increase runoff and floodwaters more effectively. Land‑use planning and zoning to reduce the exposure | |||||

Identification and evaluation of transition risk and opportunities
ACWA Power uses Integrated Assessment Models (IAMs) to explore the financial and strategic implications of three transition scenarios, ‘Delayed Transition’, ‘Current Policy’, and ‘Fragmented World’, across short‑, medium‑, long‑term timelines, identifying strategic opportunities that may arise from evolving market and regulatory environments. We use NGFS IIASA Scenario Explorer for transition scenarios assessment and NGFS CA Climate Impact Explorer for physical risk assessment. In addition, we use publicly available reports such as World Energy Outlook by IEA. Variables such as carbon pricing, demand and supply dynamics, and technological costs were considered in our evaluations. We aim to align our strategic planning with sustainable practices that mitigate risks and leverage emerging opportunities, ensuring that ACWA Power remains resilient and profitable in the face of climate‑related transitions.
| Transition risk | Scenarios | Main drivers | Potential financial impact | Residual Risk rating | Management | Opportunities | At‑risk assets | ||
|---|---|---|---|---|---|---|---|---|---|
| 2025 | 2030 | 2050 | |||||||
| Policy and legal | Delayed Transition |
|
|
|
| 36% of assets relying on fossil fuel. | |||
| Current Policy | |||||||||
| Fragmented World | |||||||||
| Market | Delayed Transition |
|
|
|
| From 4% (oil asset only) to 36% (both gas and oil). | |||
| Current Policy | |||||||||
| Fragmented World | |||||||||
| Technology | Delayed Transition |
|
|
|
| 6% of CSP assets | |||
| Current Policy | |||||||||
| Fragmented World | |||||||||
| Reputation | Delayed Transition |
|
|
|
| All | |||
| Current Policy | |||||||||
| Fragmented World | |||||||||
Emissions
- GRI 3‑3 Management of material topics
- GRI 305‑1 Direct (Scope 1) GHG emissions
- GRI 305‑2 Energy indirect (Scope 2) GHG emissions
- GRI 305‑4 GHG emissions intensity
- GRI 305‑5 Reduction of GHG emissions
- GRI 203‑1 Infrastructure investments and services supported
- GRI 302‑2 Energy consumption outside of the organisation
- GRI 302‑4 Reduction of energy consumption
Our emissions
We aim to meet our targets by focusing our investments on renewables and transitional, low CO2e emitting assets, capturing viable fuel‑switch opportunities and optimising the energy efficiency of our portfolio. In 2024, we have achieved our previously set target of 50/50 green‑brown ratio by 2030, with a recorded 50.4% total renewable energy capacity, six years ahead of schedule. Additionally, our strategy calls for about three quarters of power capacity additions to be from renewable power. Under this plan, we have renewed our target to be more ambitious of reaching 70% of renewable capacity by 2030.
CO2 refers exclusively to carbon dioxide emissions, while CO2 equivalent (CO2e) comprises the measurement of the impact of all the greenhouse gases, such as CO2, methane and nitrous oxide.
We monitor, measure and report on our portfolio’s absolute Scope 1, 2 and 3 emissions and the emission intensity, while our targets are based on ACWA Power’s equity share in our projects.
Scope 1 emissions cover ACWA Power’s direct Greenhouse Gas (GHG) emissions, for example, emissions from stationary fuel combustion from our operational assets such as power plants and thermal water plants.
Scope 2 emissions cover ACWA Power’s indirect emissions, for example due to purchases of steam and electricity from the grid.
Scope 3 Category 13 (downstream leased assets) covers the GHG emissions generated by third‑party use of ACWA Power’s finance‑lease assets.
Initiatives to reduce emissions from our assets are undertaken in two key areas: (i) reducing fuel consumption by lowering the heat rate of our thermal plants and the specific consumption at our desalination plants, and (ii) increasing renewable energy production. Our key initiative include:
- Convert the oil‑fired Shuaibah IWPP project, which is one of our largest CO2 emitters, to a new SWRO plant that will be powered by a mix of electricity from the grid and 65 MWp of solar PV. This will be operational in 2025.
In conducting our emission calculations for 2024, we aligned with the most relevant internationally recognised GHG accounting and reporting standards:
- GHG Protocol Corporate Accounting and Reporting Standard (WBCSD & WRI, 2004).
- GHG Protocol Scope 2 Guidance (WBCSD & WRI, 2015).
- GHG Protocol Corporate Value Chain (Scope 3) Accounting and Reporting Standard (WBCSD & WRI 2011).
We excluded the Scope 1 emissions from the owned transportation fleet (mobile fuel combustion emissions). We also excluded the Scope 2 emissions from grid‑supplied electricity and district heating/cooling consumption, associated with owned offices. Such emissions are not material or significant.
In 2024, the total (Scope 1 and Scope 2) CO₂e emissions across all assets measured was 21 million tonnes, a slight increase from last year. However, the overall product generation efficiency has improved by 6%. We added 5.4 GW of renewable capacity, which is about twice our flexible generation energy additions, for the same period. As generation increases from renewable resources, our portfolio’s specific emissions intensity (t CO2e/MWh) is expected to reduce. We have thus far achieved a 12% emission intensity reduction compared to 2020 baseline. We are on track to achieve our target of 50% emission intensity reduction by 2030 vs 2020.
Metrics – boundary, methodology and base year
Boundary definition
The boundary is the operational assets in which ACWA Power has equity shares and which have reached full plant Commercial Operation Date (COD). Ming Yang 1 & 2 wind and Sungrow 3 solar projects, which were acquired at the end of the financial year, will have their performance included in the next reporting cycle.
GHG emissions accounting methodology
At ACWA Power, our greenhouse gas (GHG) emissions reporting is based on the equity share approach, a methodology aligned with the GHG Protocol. This approach allows us to account specifically for emissions proportional to our ownership share in each project, ensuring we are accurately and fairly accountable for our direct impact. The equity share approach provides a clear and transparent method to report emissions, facilitating more targeted and effective sustainability strategies and compliance with international reporting standards. Previously, all emissions were reported under Scope 1 and 2 regardless of leasing arrangements. As part of our continuous improvement, we have refined our classification by reallocating emissions from assets under finance lease arrangements, where ACWA Power acts as the lessor, from Scope 1 and 2 to Scope 3, Category 13 ‑ Downstream Leased Assets, in line with GHG Protocol guidance. This adjustment is considered a boundary refinement rather than a historical correction.
Base year
The base year for GHG emissions target is 2020.
Equity basis
Please note that the emissions data below is rounded to two decimal places and therefore 0.00 signifies that the value has been rounded down and that the actual value may be, for example, 0.003 or 0.0001. A hyphen signifies zero.
Refer to the assurance report.
The intensity includes the emissions from electricity generation that cover Scope 1,2 and Scope 3 Category 13 ‑ Downstream leased assets. , t CO2e / MWh
| Scope 1&2 emissions by country | Unit | 2020 | 2022 | 2023 | 2024 |
|---|---|---|---|---|---|
| KSA | M tCO2e | 17.04 | 15.13 | 15.75 | 14.38 |
| Bahrain | M tCO2e | ‑ | 0.77 | 1.70 | 1.92 |
| Jordan | M tCO2e | 0.88 | 0.91 | 0.80 | 0.80 |
| Oman | M tCO2e | 2.81 | 2.60 | 2.72 | 2.92 |
| UAE | M tCO2e | ‑ | 0.00 | 0.00 | 0.00 |
| Morocco | M tCO2e | 0.00 | 0.00 | 0.00 | 0.00 |
| Egypt | M tCO2e | ‑ | 0.00 | 0.00 | 0.00 |
| Turkey | M tCO2e | 1.07 | 0.89 | 0.89 | 0.98 |
| South Africa | M tCO2e | ‑ | ‑ | ‑ | ‑ |
| Uzbekistan | M tCO2e | ‑ | ‑ | ‑ | ‑ |
| Total | M tCO2e | 21.80 | 20.29 | 21.85 | 20.99 |
| Scope 1 emissions by fuel type | Unit | 2020 | 2022 | 2023 | 2024 |
|---|---|---|---|---|---|
| Natural gas | M tCO2e | 9.87 | 9.14 | 11.17 | 11.55 |
| Fuel oil | M tCO2e | 11.67 | 10.87 | 10.43 | 9.22 |
| Total | M tCO2e | 21.54 | 20.01 | 21.60 | 20.78 |
| Scope 1 emissions by country | Unit | 2020 | 2022 | 2023 | 2024 |
|---|---|---|---|---|---|
| KSA | M tCO2e | 16.80 | 14.89 | 15.54 | 14.20 |
| Bahrain | M tCO2e | ‑ | 0.77 | 1.70 | 1.92 |
| Jordan | M tCO2e | 0.87 | 0.91 | 0.80 | 0.80 |
| Oman | M tCO2e | 2.80 | 2.56 | 2.67 | 2.89 |
| UAE | M tCO2e | ‑ | ‑ | ‑ | ‑ |
| Morocco | M tCO2e | ‑ | ‑ | ‑ | ‑ |
| Egypt | M tCO2e | ‑ | ‑ | ‑ | ‑ |
| Turkey | M tCO2e | 1.07 | 0.89 | 0.89 | 0.98 |
| South Africa | M tCO2e | ‑ | ‑ | ‑ | ‑ |
| Uzbekistan | M tCO2e | ‑ | ‑ | ‑ | ‑ |
| Total | M tCO2e | 21.54 | 20.01 | 21.60 | 20.78 |
| Scope 2 emissions by country | Unit | 2020 | 2022 | 2023 | 2024 |
|---|---|---|---|---|---|
| KSA | M tCO2e | 0.23 | 0.24 | 0.21 | 0.18 |
| Bahrain | M tCO2e | ‑ | ‑ | ‑ | ‑ |
| Jordan | M tCO2e | 0.00 | 0.00 | 0.00 | 0.00 |
| Oman | M tCO2e | 0.01 | 0.04 | 0.04 | 0.03 |
| UAE | M tCO2e | ‑ | 0.00 | 0.00 | 0.00 |
| Morocco | M tCO2e | 0.00 | 0.00 | 0.00 | 0.00 |
| Egypt | M tCO2e | ‑ | 0.00 | 0.00 | 0.00 |
| Turkey | M tCO2e | ‑ | ‑ | ‑ | ‑ |
| South Africa | M tCO2e | ‑ | ‑ | ‑ | ‑ |
| Uzbekistan | M tCO2e | ‑ | ‑ | ‑ | ‑ |
| Total | M tCO2e | 0.25 | 0.28 | 0.25 | 0.21 |
| Breakdown of GHG emissions | Unit | 2020 | 2022 | 2023 | 2024 |
|---|---|---|---|---|---|
| Carbon dioxide | M tCO2 | 21.50 | 19.97 | 21.55 | 20.74 |
| Methane | t CH4 | 626.84 | 582.68 | 601.71 | 562.06 |
| Nitrous oxide | t N2O | 107.79 | 100.26 | 100.45 | 91.84 |
| Emissions by activities | Unit | 2020 | 2022 | 2023 | 2024 |
|---|---|---|---|---|---|
| Scope 1 emissions for electricity production | M tCO2e | 21.12 | 19.52 | 21.11 | 20.39 |
| Scope 1 emissions for steam production | M tCO2e | 0.43 | 0.49 | 0.38 | 0.38 |
| Scope 1 emissions for water desalination | M tCO2e | 0.00 | 0.00 | 0.00 | 0.00 |
| Scope 2 emissions for electricity production | M tCO2e | 0.001 | 0.003 | 0.003 | 0.006 |
| Scope 2 emissions for water desalination (RO) | M tCO2e | 0.25 | 0.28 | 0.25 | 0.21 |
| Unit | 2020 | 2022 | 2023 | 2024 | |
|---|---|---|---|---|---|
| Electricity gross generation | MWh | 36,629,417 | 34,621,872 | 39,478,119 | 41,708,472 |
| Natural gas | MWh | 25,329,583 | 23,934,061 | 29,513,922 | 30,526,766 |
| Fuel oil | MWh | 10,979,417 | 8,889,482 | 8,034,471 | 8,110,065 |
| PV | MWh | 171,697 | 1,656,545 | 1,567,033 | 2,393,134 |
| CSP | MWh | 45,899 | 40,235 | 277,994 | 573,907 |
| Wind | MWh | 102,822 | 101,550 | 84,698 | 104,600 |
| Total emissions | MWh | 21.80 | 20.29 | 21.85 | 20.99 |
| Natural gas | t CO2e | 9.87 | 9.14 | 11.17 | 11.55 |
| Fuel oil | t CO2e | 11.67 | 10.87 | 10.43 | 9.22 |
| SWRO | t CO2e | 0.25 | 0.27 | 0.25 | 0.21 |
| PV | t CO2e | 0.00 | 0.00 | 0.00 | 0.01 |
| CSP | t CO2e | ‑ | ‑ | ‑ | ‑ |
| Wind | t CO2e | 0.00 | 0.00 | 0.00 | 0.00 |
| Scope 1 emissions | t CO2e | 21.55 | 20.01 | 21.60 | 20.78 |
| Natural gas | t CO2e | 9.87 | 9.14 | 11.17 | 11.55 |
| Fuel oil | t CO2e | 11.67 | 10.87 | 10.43 | 9.23 |
| SWRO | t CO2e | ‑ | ‑ | ‑ | ‑ |
| PV | t CO2e | ‑ | ‑ | ‑ | ‑ |
| CSP | t CO2e | ‑ | ‑ | ‑ | ‑ |
| Wind | t CO2e | ‑ | ‑ | ‑ | ‑ |
| Scope 2 emissions | t CO2e | 0.25 | 0.28 | 0.25 | 0.21 |
| Natural gas | t CO2e | ‑ | ‑ | ‑ | ‑ |
| Fuel oil | t CO2e | ‑ | ‑ | ‑ | ‑ |
| SWRO | t CO2e | 0.25 | 0.28 | 0.25 | 0.21 |
| PV | t CO2e | 0.00 | 0.00 | 0.00 | 0.00 |
| CSP | t CO2e | ‑ | ‑ | ‑ | ‑ |
| Wind | t CO2e | 0.00 | 0.00 | 0.00 | 0.00 |
| Unit | 2020 | 2022 | 2023 | 2024 | |
|---|---|---|---|---|---|
| Total Energy Consumption | MWh | 91,043,897 | 84,605,731 | 116,943,023 | 90,612,856 |
| Energy Consumption Intensity | MWh/1 | 0.019 | 0.016 | 0.019 | 0.014 |
| Natural gas | MWh | 48,833,576 | 45,216,357 | 68,328,465 | 57,150,589 |
| Fuel oil | MWh | 41,762,813 | 38,879,494 | 48,107,533 | 32,991,981 |
| Grid Import | MWh | 443,229 | 500,530 | 457,800 | 380,227 |
| Renewable Energy Consumption | Unit | 2020 | 2022 | 2023 | 2024 |
|---|---|---|---|---|---|
| PV | MWh | 839 | 6,308 | 6,391 | 10,543 |
| CSP | MWh | 3,200 | 2,805 | 42,644 | 79,336 |
| Wind | MWh | 241 | 238 | 190 | 181 |
Renewable capacity (GW)
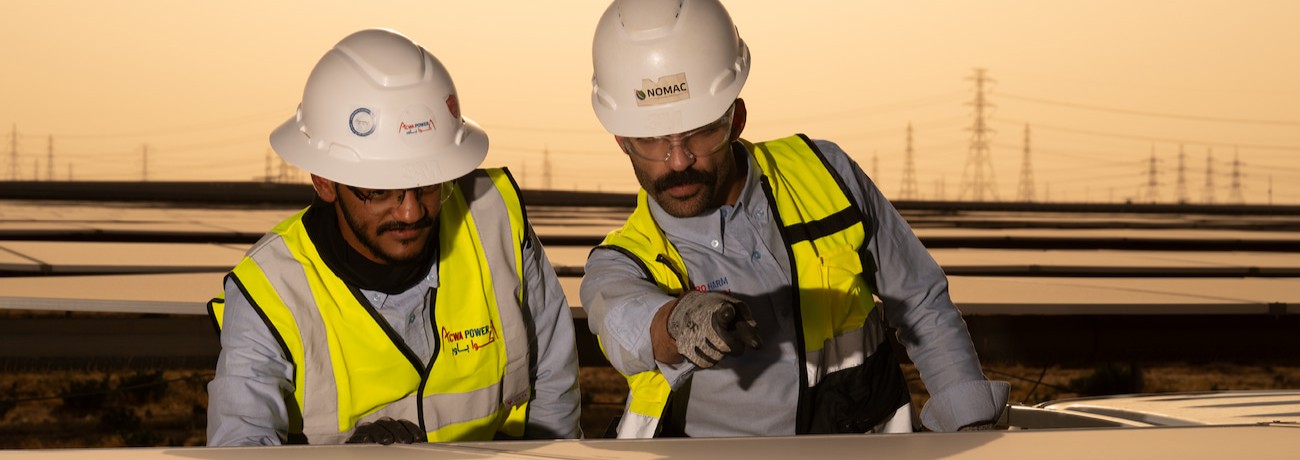
Building KSA’s largest solar PV plant in just over three years
Sudair PV IPP, KSA, is currently the largest operating single‑site solar PV plant in KSA and one of the largest of its kind in the world at a capacity of 1,500 MW.
It was completed by ACWA Power in three years and two monthsFrom Financial Close (FC) to Project Commercial Operation Date (PCOD).. The USD 924 million project has contracted power of 1500 MW.
In 2024, ACWA Power continued to significantly expand its commitment to renewable energy, reflecting our strategic focus on sustainability and environmental stewardship by being a leading company in building and operating large‑scale renewable assets. Our operational renewable capacity surged to 2.6 GW, more than doubling from 1.1 GW in 2023. Additionally, our projects under construction and in advanced development phases are set to increase our net share of renewable capacity to 19.2 GW, representing 58% of our total power capacity.
Our proactive approach to sustainability has also led to considerable environmental benefits, with emissions avoided reaching a record 2.82 Mt CO2e in 2024. The compound annual growth rate (CAGR) for emissions avoided over the last five years was approximately 23%, reflecting our increasing efficiency and capacity in renewable energy production, including significant contributions from our greenfield renewable projects. The emissions avoided calculations for our renewable energy plants adhere to the ‘ACM0002: Consolidated Methodology for Grid‑connected electricity generation from renewable sources, Version 22.0’, a framework developed by the UNFCCC. This methodology measures the displacement of electricity that would have been supplied by fossil fuel‑fired generating units in the absence of our renewable projects, thus quantifying the direct impact of our renewable generation in reducing greenhouse gas emissions.
| Year | Unit | Total portfolio emission avoidedNote that the total emission avoided includes the sold carbon credits and iRECs. | Equity basis emission avoidedNote that the total emission avoided includes the sold carbon credits and iRECs. |
|---|---|---|---|
| 2020 | Mt CO2e/ yr | 2.78 | 1.25 |
| 2021 | Mt CO2e/ yr | 3.39 | 1.81 |
| 2022 | Mt CO2e/ yr | 4.59 | 2.06 |
| 2023 | Mt CO2e/ yr | 5.31 | 2.45 |
| 2024 | Mt CO2e/ yr | 6.84 | 2.82 |
| Total | Mt CO2e/ yr | 22.91 | 10.39 |
| Total portfolio renewable capacity | Unit | 2022 | 2023 | 2024 |
|---|---|---|---|---|
| In operation | GW | 2.0 | 2.0 | 6.3 |
| Under construction | GW | 5.0 | 17.2 | 20.0 |
| Advanced development phase | GW | 10.4 | 5.3 | 8.6 |
| Total portfolio gross renewable capacity | GW | 17.4 | 24.5 | 34.9 |
| % of total portfolio gross power capacity | % | 39 | 44.5 | 50.4 |
| ACWA POWER’S NET SHARE RENEWABLE CAPACITY | ||||
| In operation | GW | 1.1 | 1.1 | 2.6 |
| Under construction | GW | 2.4 | 7.5 | 9.2 |
| Advanced development phase | GW | 5.7 | 5.2 | 7.4 |
| Total portfolio net share renewable capacity | GW | 9.2 | 13.8 | 19.2 |
| % of total portfolio net share power capacity | % | 46.9 | 53.7 | 58.2 |
Emission Avoided by Year
2024 net share of emission avoided by technology
Reliability of Supply (RoS)
In 2024, our power fleet availability reached 93.3%, marking a 1.4% increase, while our water assets availability hit 97.6%, reflecting a 1.2% improvement compared to 2023 results; these achievements prove our ongoing commitment to ensuring the reliability of our assets throughout their lifecycle, maximising plant availability and profitability while maintaining a strong focus on safety, environmental protection, and asset integrity.
To achieve these results, we completed multiple improvement initiatives, starting with phase 2 of the RoS enhancement programme, with 185 reliability actions in 30 different plants of various technologies, including PV, CSP, RO, thermal, and CCGT. The implemented actions have mitigated fleet chronic issues caused by design weaknesses, manufacturing flaws, installation QC defects and commissioning issues, which increased asset availability and improved operational reliability.
Also, we have conducted a detailed review of the fleet safety‑critical devices identification process, as well as their maintenance and inspection plans, to ensure compliance with the applicable regulations, international standards, and EPRI (Electric Power Research Institute) best practices. This review was followed by an on‑site RoS maturity assessment audit, which evaluated compliance with RoS framework requirements at selected plants in five different countries, identifying strengths and areas for improvement, which then converted to a site‑specific reliability assurance plan in each plant.
On the pre‑operations front, we continued our efforts to drive improvements, including periodic reviews of our Owner’s Technical Specifications (OTS) and enhancements to our QA/QC processes; also, we have expanded our RoS process to cover the new Green Hydrogen and BESS (battery energy storage systems) projects, with detailed RoS checklists developed by subject matter experts. This proactive approach identifies technical risks early, ensuring mitigation actions are planned and implemented before COD to secure reliable operations and the maintenance phase.
Looking forward, we finalised our preparations to launch a comprehensive reliability campaign in 2025 to enhance our reliability culture and foster a proactive asset management approach. This initiative will involve a series of change management activities, with significant engagement from top management to demonstrate ACWA Power’s leadership commitment to reliability and our belief that reliability is our reputation.
Environmental management
- GRI 2‑27 Compliance with laws and regulations
ACWA Power has developed an Environment and Social (E&S) Implementation Manual that sets out the minimum requirements for Environmental and Social Management Systems (ESMS) at all of its projects. The E&S Manual is aligned with the ISO 14001 standard, and it is designed to help each ACWA Power project company to develop and implement an ESMS that is appropriate to its specific project and context.
Every project at ACWA Power is a separate company, in which ACWA Power has a direct or indirect interest, typically 100%.
NOMAC, ACWA Power's wholly owned subsidiary, is responsible for the operations and maintenance of all ACWA Power's projects that we have operational control. NOMAC has developed plant‑specific procedures to maximise safe, secure and efficient operations and maintenance. NOMAC has five globally respected ISO standards:
| ISO 9001:2015 | Quality Management System |
| ISO 14001:2015 | Environmental Management System |
| ISO 27001:2013 | Information Security Management System |
| ISO 45001:2018 | Occupational Health and Safety Management System |
| ISO 22301:2019 | Business Continuity Management System |
In collaboration with other stakeholders in our projects, we set indicators and KPIs to promote and assure high environmental performance. We also implement feedback systems to monitor, audit and report such performance.
All our operations currently have ISO 14001 certification, to ensure the highest standards across energy usage and waste management and to minimise environmental impact. Our operations are being external audited by independent third parties, to ensure compliance with the ISO standards. Internally, we have conducted risk‑based audit with screening for all our operations periodically.
The ESMS includes a number of key elements, including:
- A policy statement that commits the project company to managing its environmental and social impacts in a responsible manner.
- A risk assessment process to identify and assess potential environmental and social impacts.
- Mitigation measures to reduce or eliminate potential environmental and social impacts.
- Monitoring and reporting procedures to track the performance of the ESMS.
- Commitment to implementing measures to reduce the consumption of natural resources, while implementing measures to prevent pollution.
ACWA Power provides support to project companies in developing and implementing their ESMSs. This support includes training in the E&S Manual, as well as technical assistance on specific topics such as energy efficiency, biodiversity management and community engagement.
By requiring all project companies to develop and implement ESMSs, ACWA Power ensures that our projects are managed in a sustainable and responsible manner. This approach is crucial not only for the environment and the communities where we operate but also aims to elevate our employees' understanding of the impacts of their work activities on the environment, fostering a culture of awareness and responsibility.
During the reporting period, we encountered a non‑compliance issue related to exceedances of ammonia and zinc levels. Although we objected based on authoritative regulations and supported our case with independent laboratory evidence confirming compliance, the regulatory body upheld its initial findings. The matter was resolved by paying a minor fine and taking corrective actions to prevent future incidents.
| Metrics | Unit | 2021 | 2022 | 2023 | 2024 |
|---|---|---|---|---|---|
| Instances of non‑ compliance which fines were incurred: Environment | Cases | 0 | 0 | 0 | 1 |
| Instances of non‑compliance which non‑monetary sanctions were incurred: Environment | Cases | 0 | 0 | 0 | 0 |
| Total monetary value for non‑compliance with laws and regulations: Environment | 1 | 0 | 0 | 0 | 10,000 |
Pioneering collaboration: ACWA Power’s joint Efforts with the Ministry of Environment, Water and Agriculture (MEWA) and the ADB (Asian Development Bank)
In the reporting year, ACWA Power engaged in policy dialogues that could impact environmental regulations. Our Environment team participated in a key workshop with MEWA and other stakeholders to discuss and suggest improvements to the Executive Regulation of Air Quality. Key issues addressed included revising Vapor Recovery System (VRS) capacity requirements and enhancing the integration of Continuous Emission Monitoring Systems (CEMS), reflecting our proactive approach in shaping policies for environmental stewardship.
In addition, ACWA Power, in partnership with the ADB, is advancing sustainable energy practices focused on renewable energy, green hydrogen, and water desalination. This collaboration aims to strengthen ACWA Power's Environmental and Social Management System (ESMS) by aligning it with international standards and enhancing risk management processes. Key initiatives include improving diagnostic studies, risk management strategies, contractor oversight, and stakeholder engagement. These efforts are expected to streamline project development, reduce risks, and enhance ACWA’s reputation as a leader in sustainable development, supported by targeted ADB training and system enhancements.
Waste management and circular economy
- GRI 306‑1 Waste generation and significant waste‑related impacts
- GRI 306‑2 Management of significant waste‑related impacts
- GRI 306‑3 Waste generated
- GRI 306‑4 Waste diverted from disposal
- GRI 306‑5 Waste directed to disposal
Environmental stewardship and compliance at ACWA Power
ACWA Power is committed to environmental excellence, consistently conducting audits exercise annually across all stages of our operations to ensure compliance with both regulatory and lender requirements. These audits, carried out by independent third parties, encompass a comprehensive range of environmental and social (E&S) aspects, including terrestrial and marine ecology, based on project‑specific Environmental and Social Impact Assessments (ESIA) and Environmental and Social Management Plans (ESMP). Waste management, a crucial part of these audits, is diligently monitored to maintain adherence to the highest standards.
ACWA Power’s waste management excellence: advancing circular economy practices
ACWA Power is committed to advancing sustainable waste management practices across all its operations. This commitment is rooted in our targets for responsible resource use and reducing waste, requiring each project site to establish specific waste reduction objectives that align with its environmental targets. Our comprehensive Environmental and Social Management System (ESMS) ensures these practices are robust and in accordance with each project’s environmental goals. As part of our ESMS, we provide targeted training to achieve waste reduction throughout our operations.
Our approach to waste management is integrated and designed to minimise environmental impact while ensuring compliance with both local and international regulatory requirements. The emphasis is on reduction, reuse, and recovery before disposal, supporting the principles of the circular economy. This innovative model moves away from the traditional linear approach of ‘take‑make‑dispose’ to a closed‑loop system where materials are continuously reused, recycled, and reduced. Our system pinpoints optimal levels for recovering individual and collective materials, aiming to maximise production savings, reduce resource costs, and conserve energy.
Waste management initiatives
ACWA Power’s commitment to environmental stewardship is demonstrated through various innovative waste management initiatives:
Recycling initiatives: organic waste is composted to enrich agricultural soil, while used paper and cardboard are recycled, reducing the need for virgin pulp and conserving natural resources.
Reuse programmes: at our Hassyan project, materials such as wooden pallets and steel scraps are repurposed to create safety barriers and useful items, reflecting our commitment to reducing waste at the source. Additionally, damaged wooden pallets are transformed into functional objects, demonstrating effective on‑site waste management.
Reduction efforts: we have significantly reduced non‑degradable waste by replacing single‑use polystyrene plates with reusable stainless‑steel trays at Hassyan, aligning with the UAE’s efforts to minimise the burden of single‑use plastics.
Our operations also focus on meticulous waste segregation, packing, labelling, storage, transportation, treatment, and disposal processes. Colour‑coded waste skips and containers facilitate effective waste management at the source, while hazardous wastes are handled with the utmost care according to strict safety procedures.
Hazardous waste management initiatives
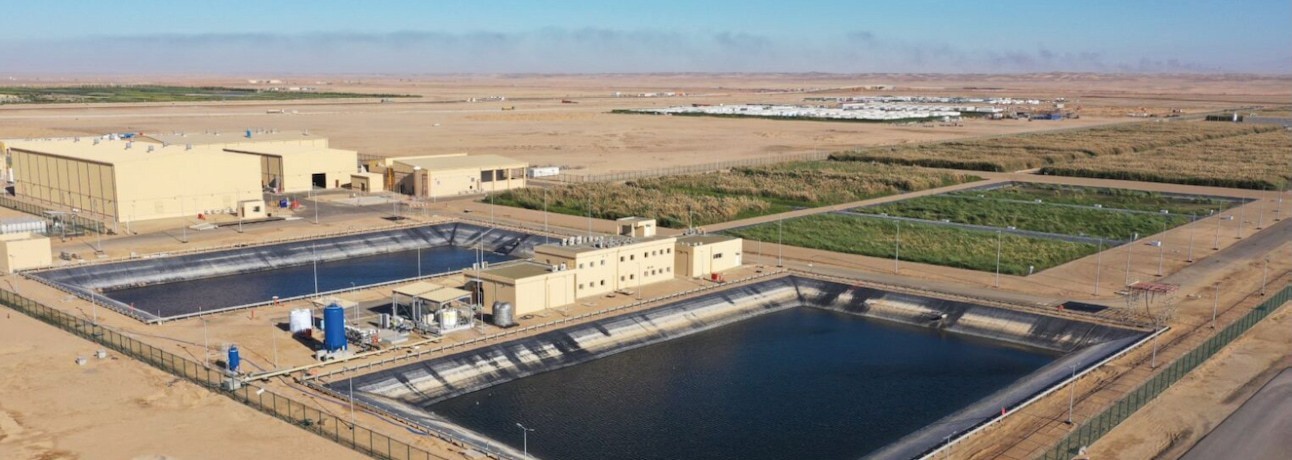
ACWA Power has partnered with AL SAFWA Cement Company (ASCC) to recycle and repurpose fly ash, referred to as ‘Carbon Ash’, from NOMAC’s SIWPP, SQWP, and ROMCO plants as an alternative energy source. This agreement enables the use of fly ash, fostering advancements in Waste‑to‑Energy (WtE) technologies. Together, we are developing innovative recycling and treatment methods to valorise industrial wastes from various sectors. ASCC brings extensive expertise in the pre‑treatment, storage, handling, and co‑processing of hazardous wastes within the cement industry, ensuring that all processes meet the highest environmental, health, and safety standards. This collaboration not only enhances resource efficiency but also contributes to sustainable industry practices by transforming hazardous waste into valuable secondary raw materials.
Effluent management
Effluent management is a critical component of our environmental strategy. We employ advanced online devices and both internal and external audits to ensure continuous monitoring and management of effluents. This rigorous approach ensures that all effluent‑related incidents are swiftly addressed, with corrective actions diligently implemented to prevent recurrence.
| Category | Metrics | Unit | 2022 | 2023 | 2024 |
|---|---|---|---|---|---|
| Waste generated | Total waste generated | Tonnes | 25,959 | 32,632 | 39,211 |
| Waste diverted from disposal | Total waste reused, recycled or recovered | Tonnes | 10,867 | 9,491 | 12,414 |
| Share of waste reused, recycled or recovered | % | 40% | 29% | 32% | |
| Hazardous waste reused, recycled or recovered | Tonnes | 28 | 22 | 84 | |
| Non‑hazardous waste reused, recycled or recovered | Tonnes | 101 | 64 | 42 | |
| Fly ash reused, recycled or recovered | Tonnes | 10,738 | 9,405 | 12,288 | |
| Waste directed to disposal | Total waste disposed | Tonnes | 15,092 | 23,141 | 26,797 |
| Hazardous waste disposed | Tonnes | 3,836 | 2,793 | 6,973 | |
| Non‑hazardous waste disposed | Tonnes | 5,250 | 11,267 | 13,662 | |
| Fly ash disposed | Tonnes | 6,006 | 9,081 | 6,162 | |
| Spills | Number of spills | 8 | 22 | 5 | |
| Total volume of spillage | m3 | 481 | 12 | 0.9 |
Hazardous waste
Although hazardous waste disposal quantity is increased compared to 2023, the quantity of hazardous waste (including fly ash) that was reused, recycled, or recovered rose by 31% over the same period. The increase in hazardous waste was mainly driven by site activities, including the cleaning of wastewater evaporation ponds, disposal of expired chemicals and cooling tower fills, as well as dismantling and disposal of old sewage treatment waste.
Spills
There were five spills during the year, with a volume of 0.9 m3. Each incident was promptly addressed in accordance with our spill response protocols, and corrective actions were implemented ensuring no major impact on the environment. Our focus remains on strengthening operational controls and risk mitigation measures to uphold environmental integrity across our operations.
Recycled waste
As a result of numerous initiatives implemented, the total volume of recycled waste increased by 31% compared to the year 2023.
Air quality
- GRI 305‑7 Nitrogen oxides (NOX), sulphur oxides (SOX), and other significant air emissions
In our ongoing commitment to sustainability, we recognise the critical importance of reducing NOX, SOX and non‑methane volatile organic compounds (VOCs) emissions in our operations. We understand our responsibility to minimise our environmental footprint, while providing reliable energy solutions.
All our project companies have ESMS in place. This includes management and mitigation measures for NOX, SOX and VOCs. At ACWA Power, we provide our project companies with tangible objectives, according to the nature of each project and its environmental target.
During our Environmental Impact Assessment studies for each of our projects, we conducted a Potential Impact, Mitigations, Management and Residual Impact study. This includes identifying all potential sources of air emissions, with detailed emissions modelling, to ensure compliance with national regulations and IFC standards. Each potential impact is assessed in terms of its likelihood and severity, with mitigation measures put in place to minimise the risk.
In our operations Continuous Emissions Monitoring Systems (CEMS) are in place to ensure compliance is maintained throughout our asset’s lifetime. As part of mitigation measures, our plants are equipped with modern low NOX burners to minimise the impact of such emissions.
In 2024, our air pollutant emissions intensity on an equity basis for NOX, SOX and VOC were
| Unit | 2022 | 2023 | 2024 | |
|---|---|---|---|---|
| Nitrogen oxide | t NOX | 51,476 | 54,075 | 54,657 |
| Sulphur oxide | t SOX | 255,974 | 241,842 | 227,363 |
| Volatile Organic Compounds | t VOCs | 1,956 | 2,096 | 2,116 |
| Intensity of NOX emissions | kg/MWh | 1.14 | 1.09 | 1.03 |
| Intensity of SOX emissions | kg/MWh | 5.66 | 4.86 | 4.27 |
| Intensity of VOC emissions | kg/MWh | 0.043 | 0.042 | 0.040 |
Water management
- GRI 203‑1 Infrastructure investments and services supported
- GRI 303‑1 Interactions with water as a shared resource
- GRI 303‑2 Management of water discharge‑related impacts
- GRI 303‑3 Water withdrawal
- GRI 303‑4 Water discharge
- GRI 303‑5 Water consumption
Sustainable and technologically advanced
We operate in water‑scarce regions, such as the Gulf, where global issues such as climate change, population growth, industrialisation and water waste are likely to increase water stress in the future. These regions’ heavy dependence on desalination poses sustainability risks itself, with cost and environmental impacts remaining key concerns. It is therefore imperative for ACWA Power to consider water management a key part of our ESG and corporate strategy. Oversight of water management policies lies with our Board of Directors, with strategy monitoring conducted at the Executive Management level.
As part of our ESMS, we aim to minimise the impact of our operations on water resources. To support this goal, we provide comprehensive awareness training to our employees on water efficiency management programs, equipping them with the necessary knowledge to optimise water use and promote the use of sustainable water sources. In our operations we encourage the use of non‑freshwater resources such as desalinated and recycled water to enhance water conservation efforts.
Water‑related risks are identified during our Environmental Impact Assessment studies that we conduct for all our projects, with mitigations measures in place to minimise any potential impact. To address these challenges, we rigorously monitor and manage key water quality metrics related to discharge such as temperature and Total Dissolved Solids (TDS) within the designated mixing zone to ensure compliance with local regulations. In addition, continuous monitoring of biodiversity and aquatic life is conducted to identify and avoid any potential negative impacts.
More than two thirds of our desalination plants use world‑class energy‑efficient technology, namely Reverse Osmosis (RO). As we grow our capacity, RO will become the sole technology used in our desalination plants. This strategic shift will not only play a critical role in reducing water production costs and energy consumption but will also significantly decrease water usage.
Water is a critical resource for our operations in both power generation and sea water desalination. Water utilised in our power plants is primarily for cooling and condensing, and almost all of the desalination water discharge is returned to the sea.
Our overall water withdrawal for 2024 was 99.95% from seawater, with 0.05% coming from freshwater. Based on the Aqueduct Water Risk Atlas, water withdrawal from the sea is considered to not affect water stress. ACWA Power is committed to using desalinated water for our activities and minimise the withdrawal of freshwater where possible.
In the reporting period, ACWA Power had not encountered non‑compliance issues related to water management. We continue to improve the measurement and reporting of our water performance by integrating internal reporting systems for water metrics.
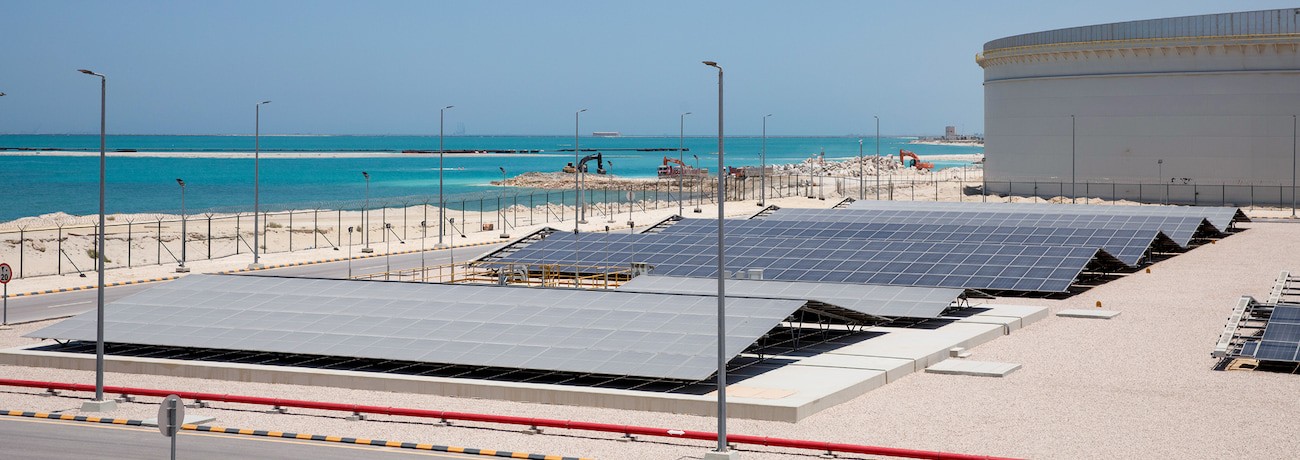
Integration of solar PV in ACWA Power’s large‑scale desalination plants
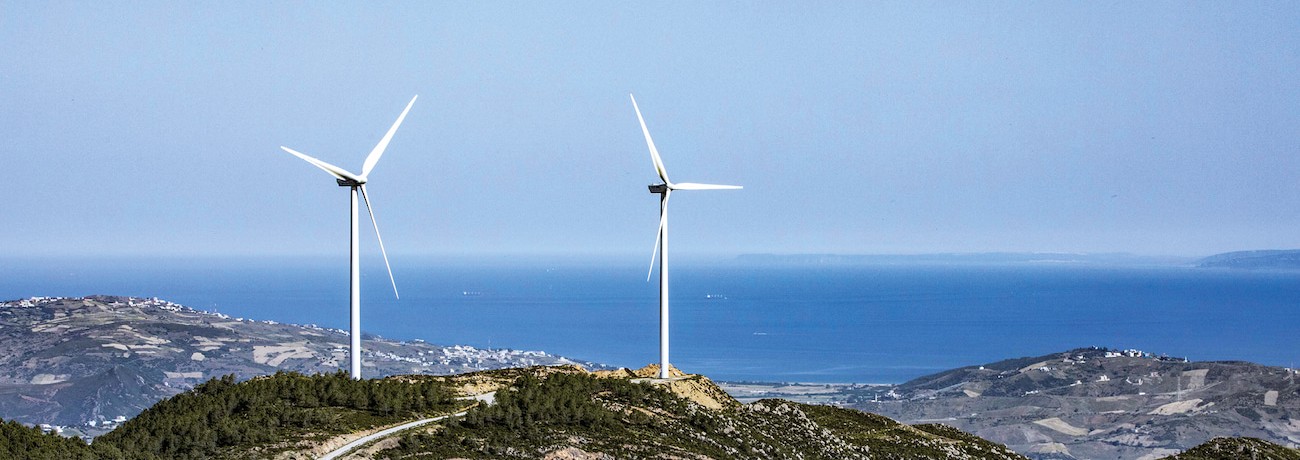
ACWA Power has strategically integrated solar PV into its desalination operations to reduce grid dependency, thereby reducing the carbon emissions of each plant. This proactive approach not only keeps us in step with worldwide sustainability efforts but also sets the stage for future expansions. We’re planning more projects that will build on the success of these initial efforts.
Key projects showcasing PV integration:
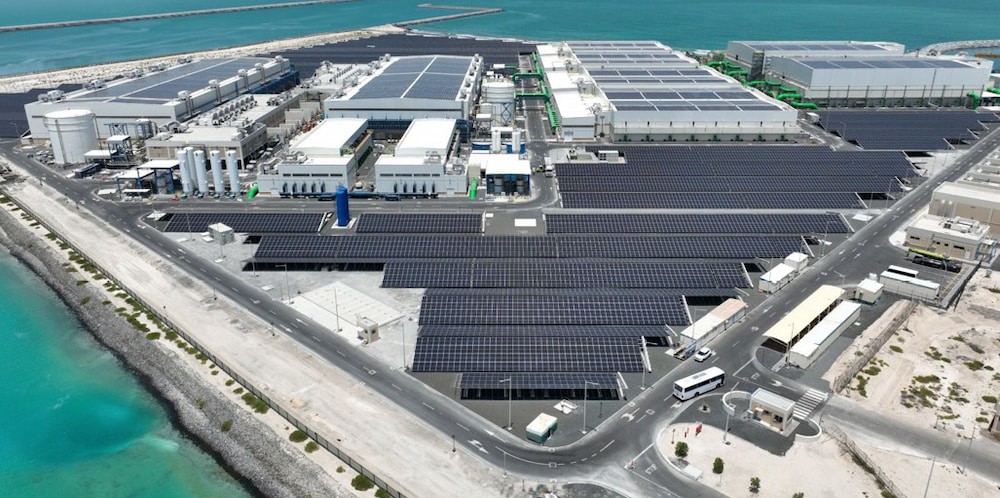
Taweelah IWP, UAE
The world’s largest reverse osmosis desalination plant with capacity of 909,200 m3/day. The plant is 44% bigger than the world’s current largest RO plant in terms of capacity and it uses 70 MWp of PV.
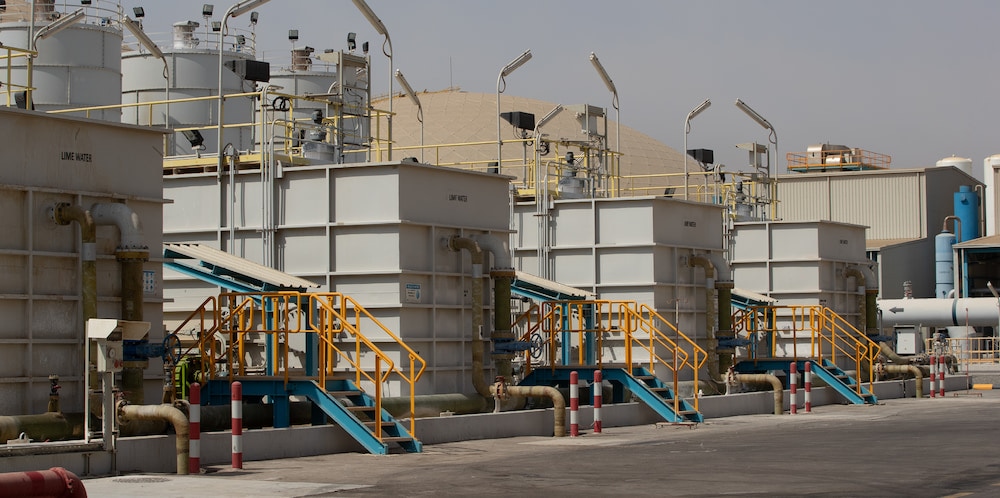
Rabigh 4 IWP, KSA
With a capacity of 600,000 m3/day and PV capacity of 6.804 MWp, this plant, under construction, is next to our existing Rabigh 3 IWP plant and is scheduled to open in Q1 2026.
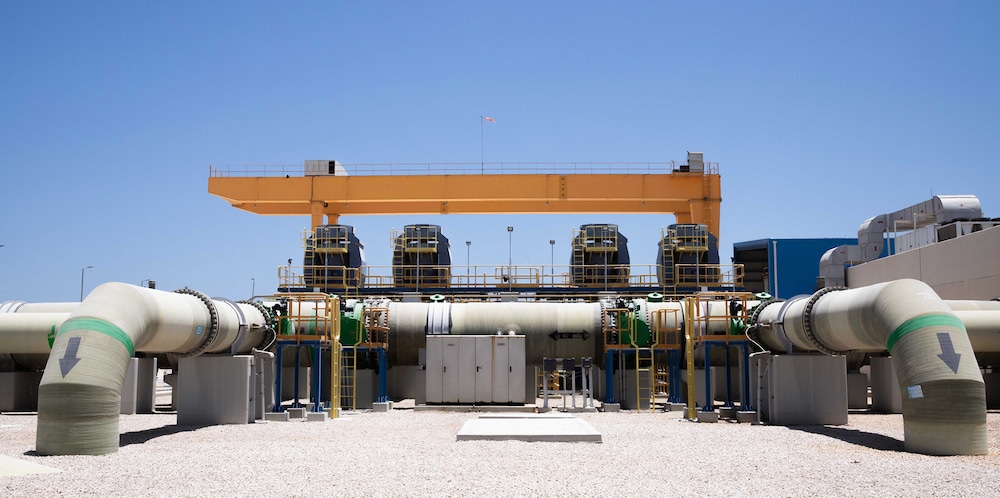
Jubail 3A IWP, KSA
This 600,000 m3/day capacity plant became fully operational in 2023 and uses 45 MWp of PV.
Shuaibah III Conversion IWP, KSA
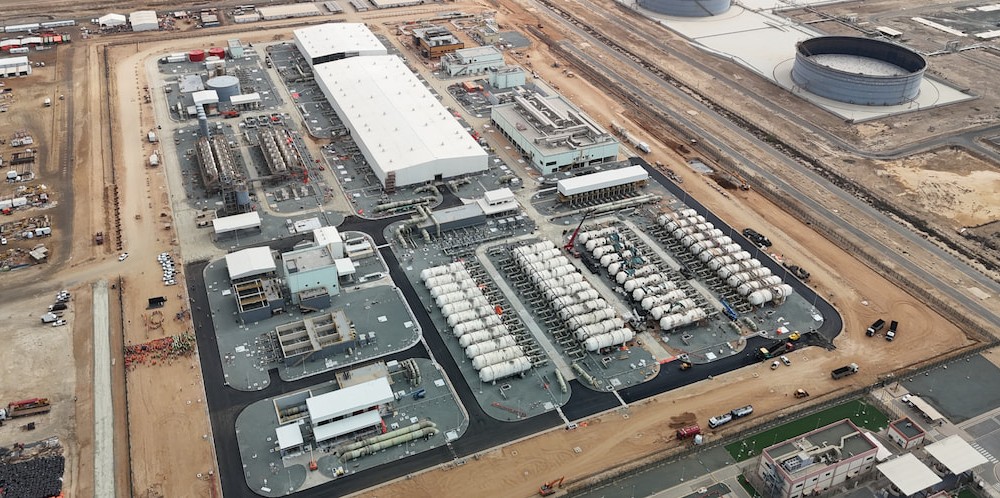
ACWA Power is converting this thermal desalination plant, with 880,000 m3/day capacity, to an RO plant, with 600,000 m3/day capacity, operating with low carbon intensive technology and reduced carbon intensity. The new plant will have integrated solar PV providing 65 MWp. This will lead to an 87% reduction in power consumption and a saving of 9 million tonnes of CO2e in total per year by avoiding fuel consumption of 22 million barrels/year.
ACWA Power’s Reverse Osmosis energy efficiency
This energy‑saving technology has thin film composite (TFC) salt rejection membranes, which provide stable operation and high separation performance. Seawater is pre‑treated (using Dissolved Air Floatation (DAF) and/or dual media filters, followed by micro‑cartridge filters) and is pressurised, using high pressure pumps, to overcome its natural osmotic pressure through reverse osmosis membranes to reject the salts and produce low salinity water.
In some projects, it is then fed to a second pass of RO membranes to further purify the brackish water and meet the desired water quality.
High pressure brine is passed through an energy recovery system to utilise the energy and exchange pressure with the incoming feedwater, which saves energy and reduces the plant’s overall consumption. Highly efficient pumps enable the RO process to operate at a specific power consumption below 3 kWh/m3 (which is almost half the amount of energy required to desalinate sea water by RO ten years ago). In addition, the captive PV solution has further reduced electricity import from the grid, resulting in low GHG emissions.
Brine is returned to sea through diffusers to ensure that the effect on the local ecology is minimal. Salinity rise within the sea is controlled by running a hydrodynamic model to determine the diffuser design. Diffusers are also located at deeper water depths to ensure proper dispersion and virtually no impact on sea life. The process is subject to thorough environmental impact assessment and approval by the local regulator.
We are now using a new generation of high efficiency pumps, pressure exchangers and membranes, which offer improved performance with reduced brine mixing and enhanced salt rejection rates. In addition, ACWA Power uses online analysers to monitor and maintain a high‑quality potable water.
Our RO desalination plants are ideally suited to the water‑deficient regions of the Middle East and Africa. We are not responsible for water distribution to consumers directly; we supply in bulk to some of the world’s largest offtakers, such as SWPC, DEWA, EWA, EWEC, and OPWP.
We are developing a range of RO plants, from as small as the 1,000 m3/day Red Sea Project to the world’s largest RO plant at Taweelah IWP, producing 909,200 m3/day. We optimise the specific power consumption and availability to deliver the lowest water tariffs, for human consumption and agricultural use. We ensure compliance with the product water quality requirements set by the offtaker and consistently meet the thresholds, even with variations in feed water quality. We have also implemented artificial intelligence within plant operations and control which has improved power consumption and further availability and reliability. In 2025, we are expecting further improvements in AI implementation within plant operations to reduce power consumption and chemical use, predict failures and enhance preventive maintenance.
At Hassyan IWP (capacity of 818,000 m3/day), we have achieved the lowest water tariff in the history of desalination, $0.365/m3 (which is almost 10% lower than the previous record), by optimising specific power consumption and using efficient process design. We plan to continue optimising consumption and lowering tariffs.
All our plants are designed, constructed, and operated to meet the product water (PW) standards required by both our offtakers and the WHO. Some of our plants produce water for industrial purposes, while other plants produce water for agriculture.
ACWA Power is now exploring and piloting a new desalination method, Gravitational Vapor Compression (GVC), which is expected to be more energy‑efficient than any other current technology.
In desalination we have achieved an energy consumption reduction of 87% since 2010. We have gone through three phases to accomplish this: the first phase, from 2010 to 2012, entailed moving away from thermal coupling to RO and this enabled us to reduce the Specific Power Consumption (SPC) from
To further our technological improvements in water desalination, ACWA Power collaborates with the King Abdullah University of Science and Technology (KAUST). The partnership aims to prioritise research in water quality monitoring and system performance modelling using several KAUST research centres. ACWA Power is expanding its partnerships and collaborations to enhance innovation, ensuring continued excellence without compromising environmental impact. This strategy helps maintain our competitive edge in providing sustainable solutions in water desalination and addressing the growing demands for freshwater.
Seawater desalination – environmental concerns and mitigation
ACWA Power identifies and manages the environmental impacts at its desalination plants, as indicated in the table below.
| Concern | Mitigation |
|---|---|
| Concentrate discharge | Disperse concentrate through multiport diffuser |
| Marine pollution | Treatment of all backwashing and cleaning wastes |
| Seawater intakes | Use subsurface or submerged intakes with low intake velocities |
| Chemical use | Implement low/no chemical technologies |
| Material use | Improve recyclability and reuse of materials |
| Land use | Minimise land use and landscape impacts through site selection |
| Energy use and GHGs | Use renewable power sources and digital technologies |
Our desalination projects adhere to the rigorous environmental protection regulation mandated by the Equator Principles of Finance institutions (IFC) and the World Bank, ensuring minimal ecological impact. An independent audit conducted for ACWA Power’s Rabigh 3 IWP, has confirmed no significant ecological impact in the aquatic ecosystem, reinforcing our commitment to sustainable operations.
Brine management
Minimising the environmental impact of brine discharges (defined in multiple engineering references, e.g., American Water Works Association – AWWA) requires an integrated project development approach.
- Early site selection to avoid sensitive habitats.
- High‑efficiency multiport diffusers to ensure optimal initial dilution of brine.
- Advanced hydrodynamic modelling to maximise brine dilution and minimise environmental impact.
- Real‑time monitoring and extensive marine surveys during both construction and operation phases.
We have made significant strides in increasing the efficiency of the RO process, enhancing water recovery rates from 37% to 45%, moving closer to the thermodynamic limit of 60% at 70 bar. This high recovery rate reduces the volume of brine discharge and minimises the intake of juvenile fish and larvae. Our plants also optimise chemical usage, further reducing environmental impacts.
A key achievement in our operational strategy is the transition from thermal desalination to more sustainable technologies. For instance, the Taweelah IWP in UAE derives a third of its energy from on‑site PV, while our Red Sea Global RO units are powered entirely by renewable energy. This shift significantly reduces both the negative impact on marine environment and our carbon footprint.
Looking forward, we are exploring innovative solutions such as brine mining and the potential for Zero Liquid Discharge systems to further reduce environmental impacts. Our long‑term collaboration with renowned marine consultants ensures continuous improvement in our operational processes and environmental strategies.
Water risk assessment
At ACWA Power, understanding the relationship between water and our business is crucial, given our operational footprints in regions prone to water stress. This relationship is governed by our dependencies on water for operational needs and our potential impact on local water resources. Specifically, our focus is sharpened on three dimensions of water stress: scarcity, quality, and access. The risk assessment outcomes are integrated into the business strategy. To systematically assess and address these issues, we use the Aqueduct Water Risk Atlas v4.0, developed by World Resources Institute (WRI). This tool enables us to analyse baseline water stress around our operating asset locations under various future scenarios – Business as Usual (BAU), Optimistic, and Pessimistic – projecting changes up to the years 2030 (2015–2045), 2050 (2035–2065), and 2080 (2065–2095).
The ‘BAU’ scenario represents a middle‑of‑the‑road future that is similar to NGFS’s fragmented world scenario. It is a scenario characterised by regional competition and inequality, including slow economic growth, weak governance and institutions, low investment in the environment and technology, and high population growth, especially in developing countries.
The ‘optimistic’ scenario represents a future that limits the rise in average global surface temperatures by 2100 to below 2°C, which is aligned to NGFS’s delayed transition. It is characterised by sustainable socioeconomic growth, stringent environmental regulations and effective institutions, rapid technological change and improved water use efficiencies.
The ‘pessimistic’ scenario represents a future where insufficient mitigation efforts lead to severe temperature increases and high levels of impact.
The assessment has been conducted for the existing power and water desalination operating assets. This comprehensive approach helps us navigate the complexities of water management in a changing climate, ensuring sustainable operations while mitigating water‑related risks.
The baseline water stress risk assessment indicates the arid and low‑water use areas remain consistent (37.5%) across all years and scenarios. Notably, both the BAU and pessimistic scenarios predict an increase in ‘High’ and ‘Extremely high’ water stress categories in 2080, signalling a worsening condition under less proactive or adverse conditions. The optimistic scenario, however, shows stable water stress levels across all categories, suggesting that effective management and favourable environmental actions can maintain or improve water stress outcomes. This stability indicates that the business may face less fluctuation and may not need to significantly adapt its operations due to changes in water stress levels.
This comparison highlights the importance of proactive water management strategies to mitigate risks, especially under scenarios that project increasing water stress. In 2024, the freshwater withdrawal from all ACWA power’s operating assets is 0.1% out of total water withdrawal, 99.95% of withdrawal comes from seawater. ACWA Power as one of the world’s largest desalination water companies, had provided 192 times more freshwater to water stress regions than it withdrew, exemplifies a commitment to sustainable water management by operating as a water‑positive entity.
Water Metrics: Equity Basis
The boundary is the operational assets in which ACWA Power has equity shares and which have reached full plant Commercial Operation Date (COD). In contrast to last year's report, which presented water metrics on a total portfolio basis, this year's disclosure is provided on an equity basis to more accurately reflect our share of operational impacts and enhance the comparability of performance across our business.
| Unit | 2023 | 2024 | |
|---|---|---|---|
| WATER WITHDRAWAL | |||
| Total volume of water withdrawn | Mega Litres | 8,828,569 | 5,522,328 |
| Surface water | Mega Litres | 4,485 | 4,905 |
| Groundwater | Mega Litres | 111 | 135 |
| Seawater | Mega Litres | 8,823,310 | 5,516,833 |
| Produced water | Mega Litres | ‑ | ‑ |
| Third‑party water | Mega Litres | 663 | 455 |
| All water withdrawal from water stressed areasWater stress is measured at site level. The methodology used to assess baseline water stress is WRI’s Aqueduct Water Risk Atlas. | |||
| From areas with arid and low water use | % | 45 | 38 |
| From areas with low stress levels | % | 0 | 6 |
| From areas with low to medium stress levels | % | 9 | 6 |
| From areas with medium to high stress levels | % | 6 | 8 |
| From areas with high stress levels | % | 3 | 4 |
| From areas with extremely high stress levels | % | 36 | 38 |
| Freshwater withdrawal from water stressed areasWater stress is measured at site level. The methodology used to assess baseline water stress is WRI’s Aqueduct Water Risk Atlas. | |||
| From areas with arid and low water use | % | 38 | 35 |
| From areas with low stress levels | % | 0 | ‑ |
| From areas with low to medium stress levels | % | 19 | 18 |
| From areas with medium to high stress levels | % | 13 | 12 |
| From areas with high stress levels | % | 6 | 6 |
| From areas with extremely high stress levels | % | 25 | 29 |
| Freshwater withdrawal quantity | Mega Litres | 5,259 | 5,495 |
| Freshwater withdrawal percentage | % | 0.06 | 0.10 |
| Freshwater withdrawal intensity by revenue | Mega Litres / million 3 | 0.9 | 0.9 |
| WATER DISCHARGE | |||
| Total volume of water discharge | Mega Litres | 9,924,520 | 4,732,825 |
| Surface water | Mega Litres | 1,184 | 1,625 |
| Groundwater | Mega Litres | ‑ | ‑ |
| Seawater | Mega Litres | 7,923,336 | 4,731,200 |
| Produced water | Mega Litres | ‑ | ‑ |
| Third‑party water | Mega Litres | ‑ | ‑ |
| Water export | Mega Litres | 653,640 | 741,839 |
| WATER CONSUMPTION | |||
| Total water consumptionValues are independently assured by KPMG. Refer to the assurance report. Water consumption = Internal water consumption and water export. | Mega Litres | 904,049 | 789,503 |
| Internal water consumption | Mega Litres | 250,409 | 34,497 |
| Freshwater consumption | Mega Litres | 4,075 | 3,870 |
| Freshwater consumption intensity by revenue | Mega Litres/million 1 | 0.7 | 0.6 |
| Magnitude of water export vs freshwater consumed | ‑ | 160 | 192 |
| Seawater | Sea |
| Surface water | River, Dam, Evaporation pound |
| Third‑party water | Government, DEWA, Tanker, Supplier |
| Groundwater | Water well |
Biodiversity
- GRI 304‑1 Operational sites owned, leased, managed in, or adjacent to, protected areas and areas of high biodiversity value outside protected areas
- GRI 304‑2 Significant impacts of activities, products and services on biodiversity
- GRI 304‑3 Habitats protected or restored
- GRI 304‑4 IUCN Red List species and national conservation list species with habitats in areas affected by operations
Management and framework
As signatories to the Convention on Biological Diversity (CBD) and participants in the global effort under the Kunming‑Montreal Global Biodiversity Framework, the countries where ACWA Power operates have committed to preserving biological diversity and implementing sustainable practices. In alignment with these commitments as well as Saudi Vision 2030, ACWA Power is developing a Corporate Biodiversity Framework to guide all biodiversity‑related activities across our global portfolio. This framework aims to:
- Establish biodiversity standards and procedures that integrate seamlessly into project planning, development, and operational phases.
- Develop clear, actionable guidelines for implementing biodiversity initiatives that reflect the Company’s environmental stewardship commitments.
- Ensure compliance with national legal obligations where we operate, as well as meet the rigorous biodiversity requirements of financial institutions and stakeholders.
This structured approach will organise, measure, and enhance the impact of our biodiversity efforts, incorporating robust monitoring and evaluation mechanisms to track performance, assess risks, and quantify conservation outcomes.
At ACWA Power, effective governance of biodiversity issues is a shared responsibility between the Board of Directors and senior management, ensuring strategic oversight and integration into our core business practices. The appointment of a Corporate Biodiversity Manager at ACWA Power is a significant step towards embedding biodiversity as a core pillar of our sustainability agenda. The role has been designed to provide a focused, strategic approach to managing bio diversity, ensuring that our efforts are aligned with both local legal requirements and international best practices, including those outlined by major financial institutions and global sustainability frameworks.
ACWA Power’s action on biodiversity
ACWA Power is committed to enhancing ecological restoration and conservation across the regions where we operate. We actively collaborate with local communities, NGOs, and government bodies to restore degraded habitats, protect endangered species, and support long‑term conservation efforts. Through these initiatives, we aim to contribute significantly to reversing biodiversity loss and achieving the global biodiversity targets outlined in frameworks such as the Kunming‑Montreal Global Biodiversity Framework.
A critical component of our strategy is the integration of biodiversity considerations into ACWA Power’s Environmental and Social Management Systems (ESMS). By embedding these considerations into our overarching sustainability policies and practices, we ensure that biodiversity is treated not as an isolated issue but as an integral part of our environmental responsibilities. This holistic approach enhances our ability to mitigate impacts on ecosystems, protect critical habitats, and promote biodiversity conservation throughout our value chain.
Our biodiversity efforts follow a structured mitigation hierarchy approach — avoid, minimise, restore, and offset —to achieve no net loss in all sites and projects and ultimately to reach a net‑positive impact on ecosystems. This approach ensures that conservation outcomes are substantial enough to outweigh any residual losses, thereby balancing development needs with ecological preservation. This commitment is operationalised in every stage of project development and execution, making biodiversity a key consideration from inception through to completion.
All our projects undergo comprehensive Environmental and Social Impact Assessments (ESIAs) to evaluate potential negative impacts on local wildlife and vegetation. These assessments guide the development of tailored mitigation and offsetting strategies for each project, addressing specific risks in a targeted manner. Our activities are conducted in strict adherence to the best practices and standards set by international organisations such as the International Finance Corporation (IFC), World Bank Group (WBG), European Bank for Reconstruction and Development (EBRD), and Asian Development Bank (ADB). These rigorous assessments are crucial as our activities may inadvertently impact biodiversity, such as disrupting local flora or wildlife habitats, and pose risks related to bird collisions with wind turbines and power lines, as well as bird electrocutions.
As mitigation measures, we implement both avoidance measures, considering the most critical biodiversity and vulnerable species habitats during activity planning, such as avoiding wintering, migration, or breeding/plant growth areas, and aligning construction schedules and other activities with periods of minimal disturbance to sensitive species, and active measures.
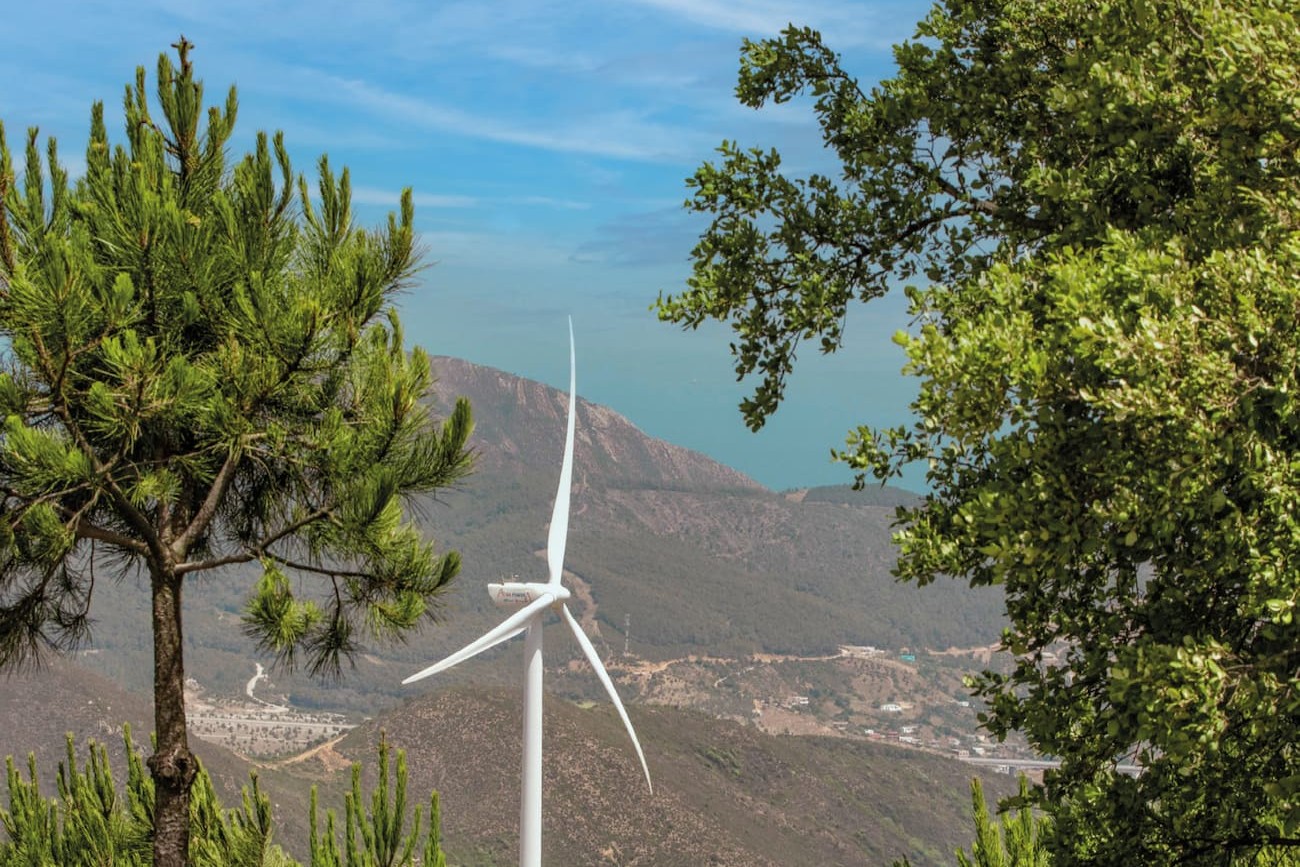
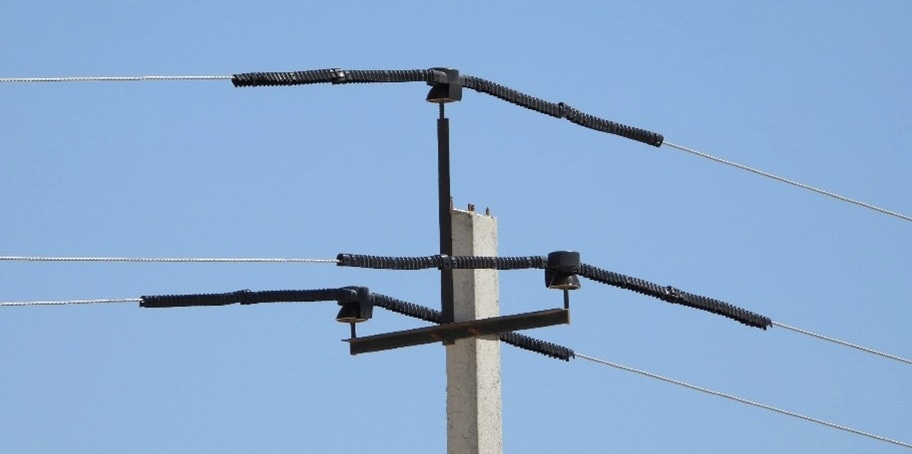
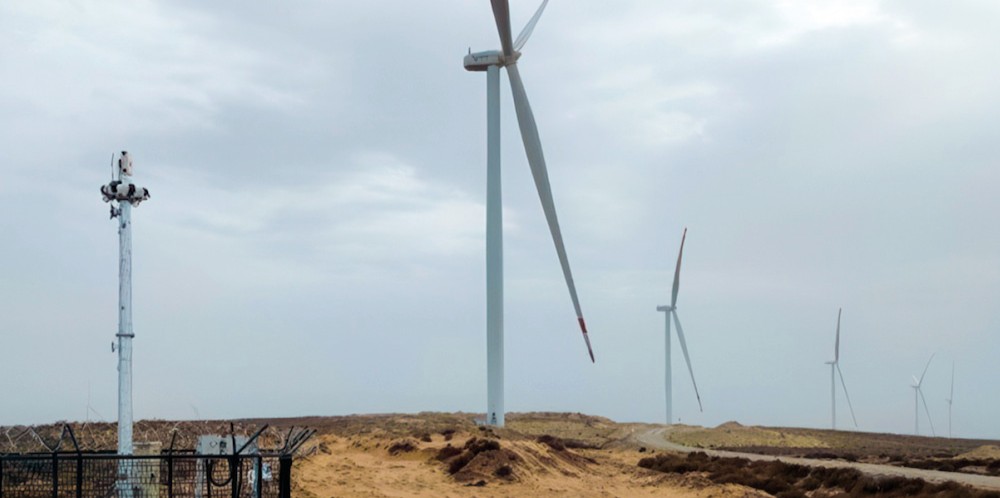
Active measures include installing bird protection devices and bird flight diverters to minimise risks of electrocution and bird collisions with power lines; integrating AI shutdown‑on‑demand cameras at wind farms to prevent collisions of vulnerable species with wind turbines; relocating tortoises and geckos before (and during) operations; replanting vegetation; and collecting seeds for subsequent flora restoration efforts.
Biodiversity Data
At ACWA Power, we are committed to monitoring, assessing, and transparently disclosing our biodiversity risks, dependencies and impacts, in alignment with the Kunming‑Montreal Global Biodiversity Framework (target 15) and GRI Standards.
To safeguard biodiversity, we establish a buffer zone of at least 5 kms around each project boundary, adhering to best practices that relate to interactions with protected nature conservation areas and key biodiversity areas. Our approach is guided by compliance with International Union for Conservation of Nature (IUCN) protected area management categories, the Ramsar Convention, CBD, lenders and national regulations.
As part of our transparency, we report on assets located within or near key biodiversity areas and assess the potential risks to species and ecosystem, in addition to reporting on actions we take to conserve, restore and offset our impact. We prioritise disclosure of species that have IUCN conservation status (near threatened, critically endangered, endangered and vulnerable) identified within our asset’s areas. For more detailed list of species assessments, mitigation measures and biodiversity management measures please refer to the ESIA reports available on our websites.
The following table shows the assets that located within or near sensitive habitats in the buffer zone and summarises the actions that have been taken to minimise our impact to conserve these fragile ecosystems and habitats.
Bird protection device installed on low‑voltage line
Observation camera installed at a wind park
| Site | Within the protected area | Project area within the protected area (km2) | Nearby protected area | Type of protection | Main IUCN red list of threatened species | Reference document |
|---|---|---|---|---|---|---|
| Shuaa Energy 3 PV | Yes ‑ Al Marmoom Conservation Area | 10.2 | No | Category II (National Park) under the IUCN Protected area category | Vulnerable: Arabian Oryx, Arabian Gazella and Sand Gazella | |
| Hassyan IWP & IPP | Yes ‑ Jebel Ali Marine Sanctuary | 0.3 | Adjacent to Jebel Ali Wetland Sanctuary | RAMSAR Site | Critically Endangered: Hawksbill Turtles, Steppe Eagle Endangered: Green Turtle, Sociable Lapwing, Vulnerable: Socotra Cormorant | |
| Al‑Mowyah Solar IPP | No | No | 4 km to the east of Mahazat As‑Sayd Reserve | Category Ia (Strict Nature Reserve) under the IUCN Protected area category | Endangered: Lappet‑faced Vulture, Egyptian Vulture, Saker Falcon, Steppe Eagle Vulnerable: Eastern Imperial Eagle, Greater Spotted Eagle, Asian Houbara, Egyptian Spiny-tailed Lizard, Arabian Sand Gazelle |
Case studies
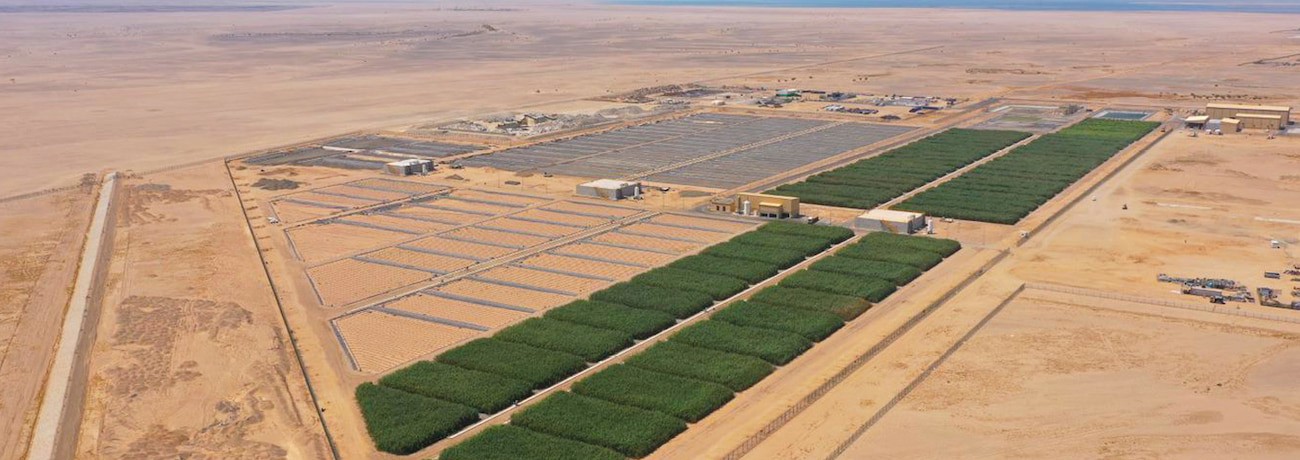
The off‑grid, circular economy at the Red Sea project
This circular economy solution will now treat
The wetland approach to sewage treatment starts at the screening stage to remove solid matter. After this, effluent is sent to the wetland site made up of phragmites plants, a type of common reed, which naturally absorbs the nutrients and metals, treating the water without the need for chemicals.
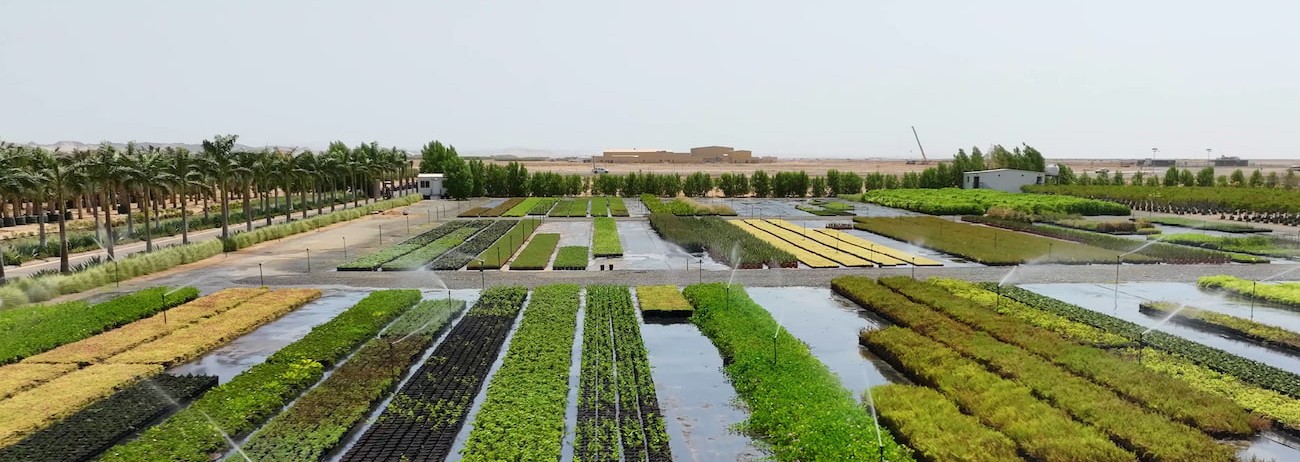
Once treated and in compliance with the national regulation for water quality, the Treated Sewage Effluent (TSE) is transferred to RSG’s Landscape Nursery, which, with an area of more than 100 ha, is the largest in the Middle East, to irrigate the trees and shrubs. To date, more than five million plants have been grown to landscape RSG’s destinations, and 30 million will be grown by 2030.
When the phragmites reeds grow too long or stop effective water treatment, they are pruned, and the ends are sent to an Integrated Waste Management Facility. Here they are recycled and with other waste materials made into bricks for the project construction.
Biodiversity Action Plan (BAP) at the Hassyan plant
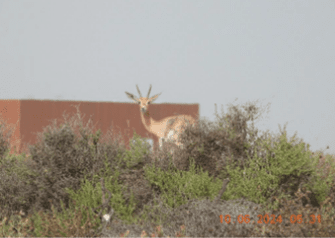

An Arabian Gazelle (left photo) and an Arabian Red Fox (right photo) in the Hassyan project area.
The Hassyan Independent Power Plant (IPP) Phase 1 is a 2,400 MW power generation facility located within Dubai’s Jebel Ali Wetland Sanctuary, a Ramsar‑designated site. Recognising the ecological significance of its location, a comprehensive Biodiversity Action Plan (BAP) was established to mitigate potential impacts on biodiversity and promote ecological enhancement.
Implementation strategy
The BAP incorporates Environmental Impact Assessment (EIA) and Environmental Management Plans (EMPs). Key activities include coral translocation, mangrove habitat protection, and seagrass restoration. During construction, exclusion zones are established to protect sensitive habitats, and monitoring of water quality, sediment, and marine life is conducted on a quarterly basis. The BAP integrates adaptive management principles, allowing modifications in response to environmental changes or unforeseen impacts.
Monitoring and Key Performance Indicators (KPIs)
To track progress, specific KPIs have been set, including no net loss of terrestrial ecosystem composition, protection of keystone species, and monitoring of coral, seagrass, and marine biodiversity. Monitoring activities are conducted monthly, quarterly, or annually, depending on the aspect being evaluated, with reports submitted to Dubai Municipality to ensure compliance.
Outcomes and achievements
The BAP has transferred 29,000 corals and restored lagoon habitats. Furthermore, it has driven the creation of habitats for seagrass, avifauna, and marine life, supporting Dubai’s commitment to biodiversity conservation as a signatory to the CBD.
The ongoing monitoring and adaptive management framework ensure continuous improvement, with long‑term benefits for both biodiversity and the broader community.